
license: cc0-1.0
tags:
  - biology
  - single-cell
  - RNA
  - chemistry
size_categories:
  - 100M<n<1B
configs:
  - config_name: expression_data
    data_files: data/train-*
    default: true
  - config_name: sample_metadata
    data_files: metadata/sample_metadata.parquet
  - config_name: gene_metadata
    data_files: metadata/gene_metadata.parquet
  - config_name: drug_metadata
    data_files: metadata/drug_metadata.parquet
  - config_name: cell_line_metadata
    data_files: metadata/cell_line_metadata.parquet
  - config_name: obs_metadata
    data_files: metadata/obs_metadata.parquet
  - config_name: pseudobulk_differential_expression
    data_files: metadata/pseudobulk_differential_expression/train-*
dataset_info:
  features:
    - name: genes
      sequence: int64
    - name: expressions
      sequence: float32
    - name: drug
      dtype: string
    - name: sample
      dtype: string
    - name: BARCODE_SUB_LIB_ID
      dtype: string
    - name: cell_line_id
      dtype: string
    - name: moa-fine
      dtype: string
    - name: canonical_smiles
      dtype: string
    - name: pubchem_cid
      dtype: string
    - name: plate
      dtype: string
  splits:
    - name: train
      num_bytes: 1693653078843
      num_examples: 95624334
  download_size: 337644770670
  dataset_size: 1693653078843
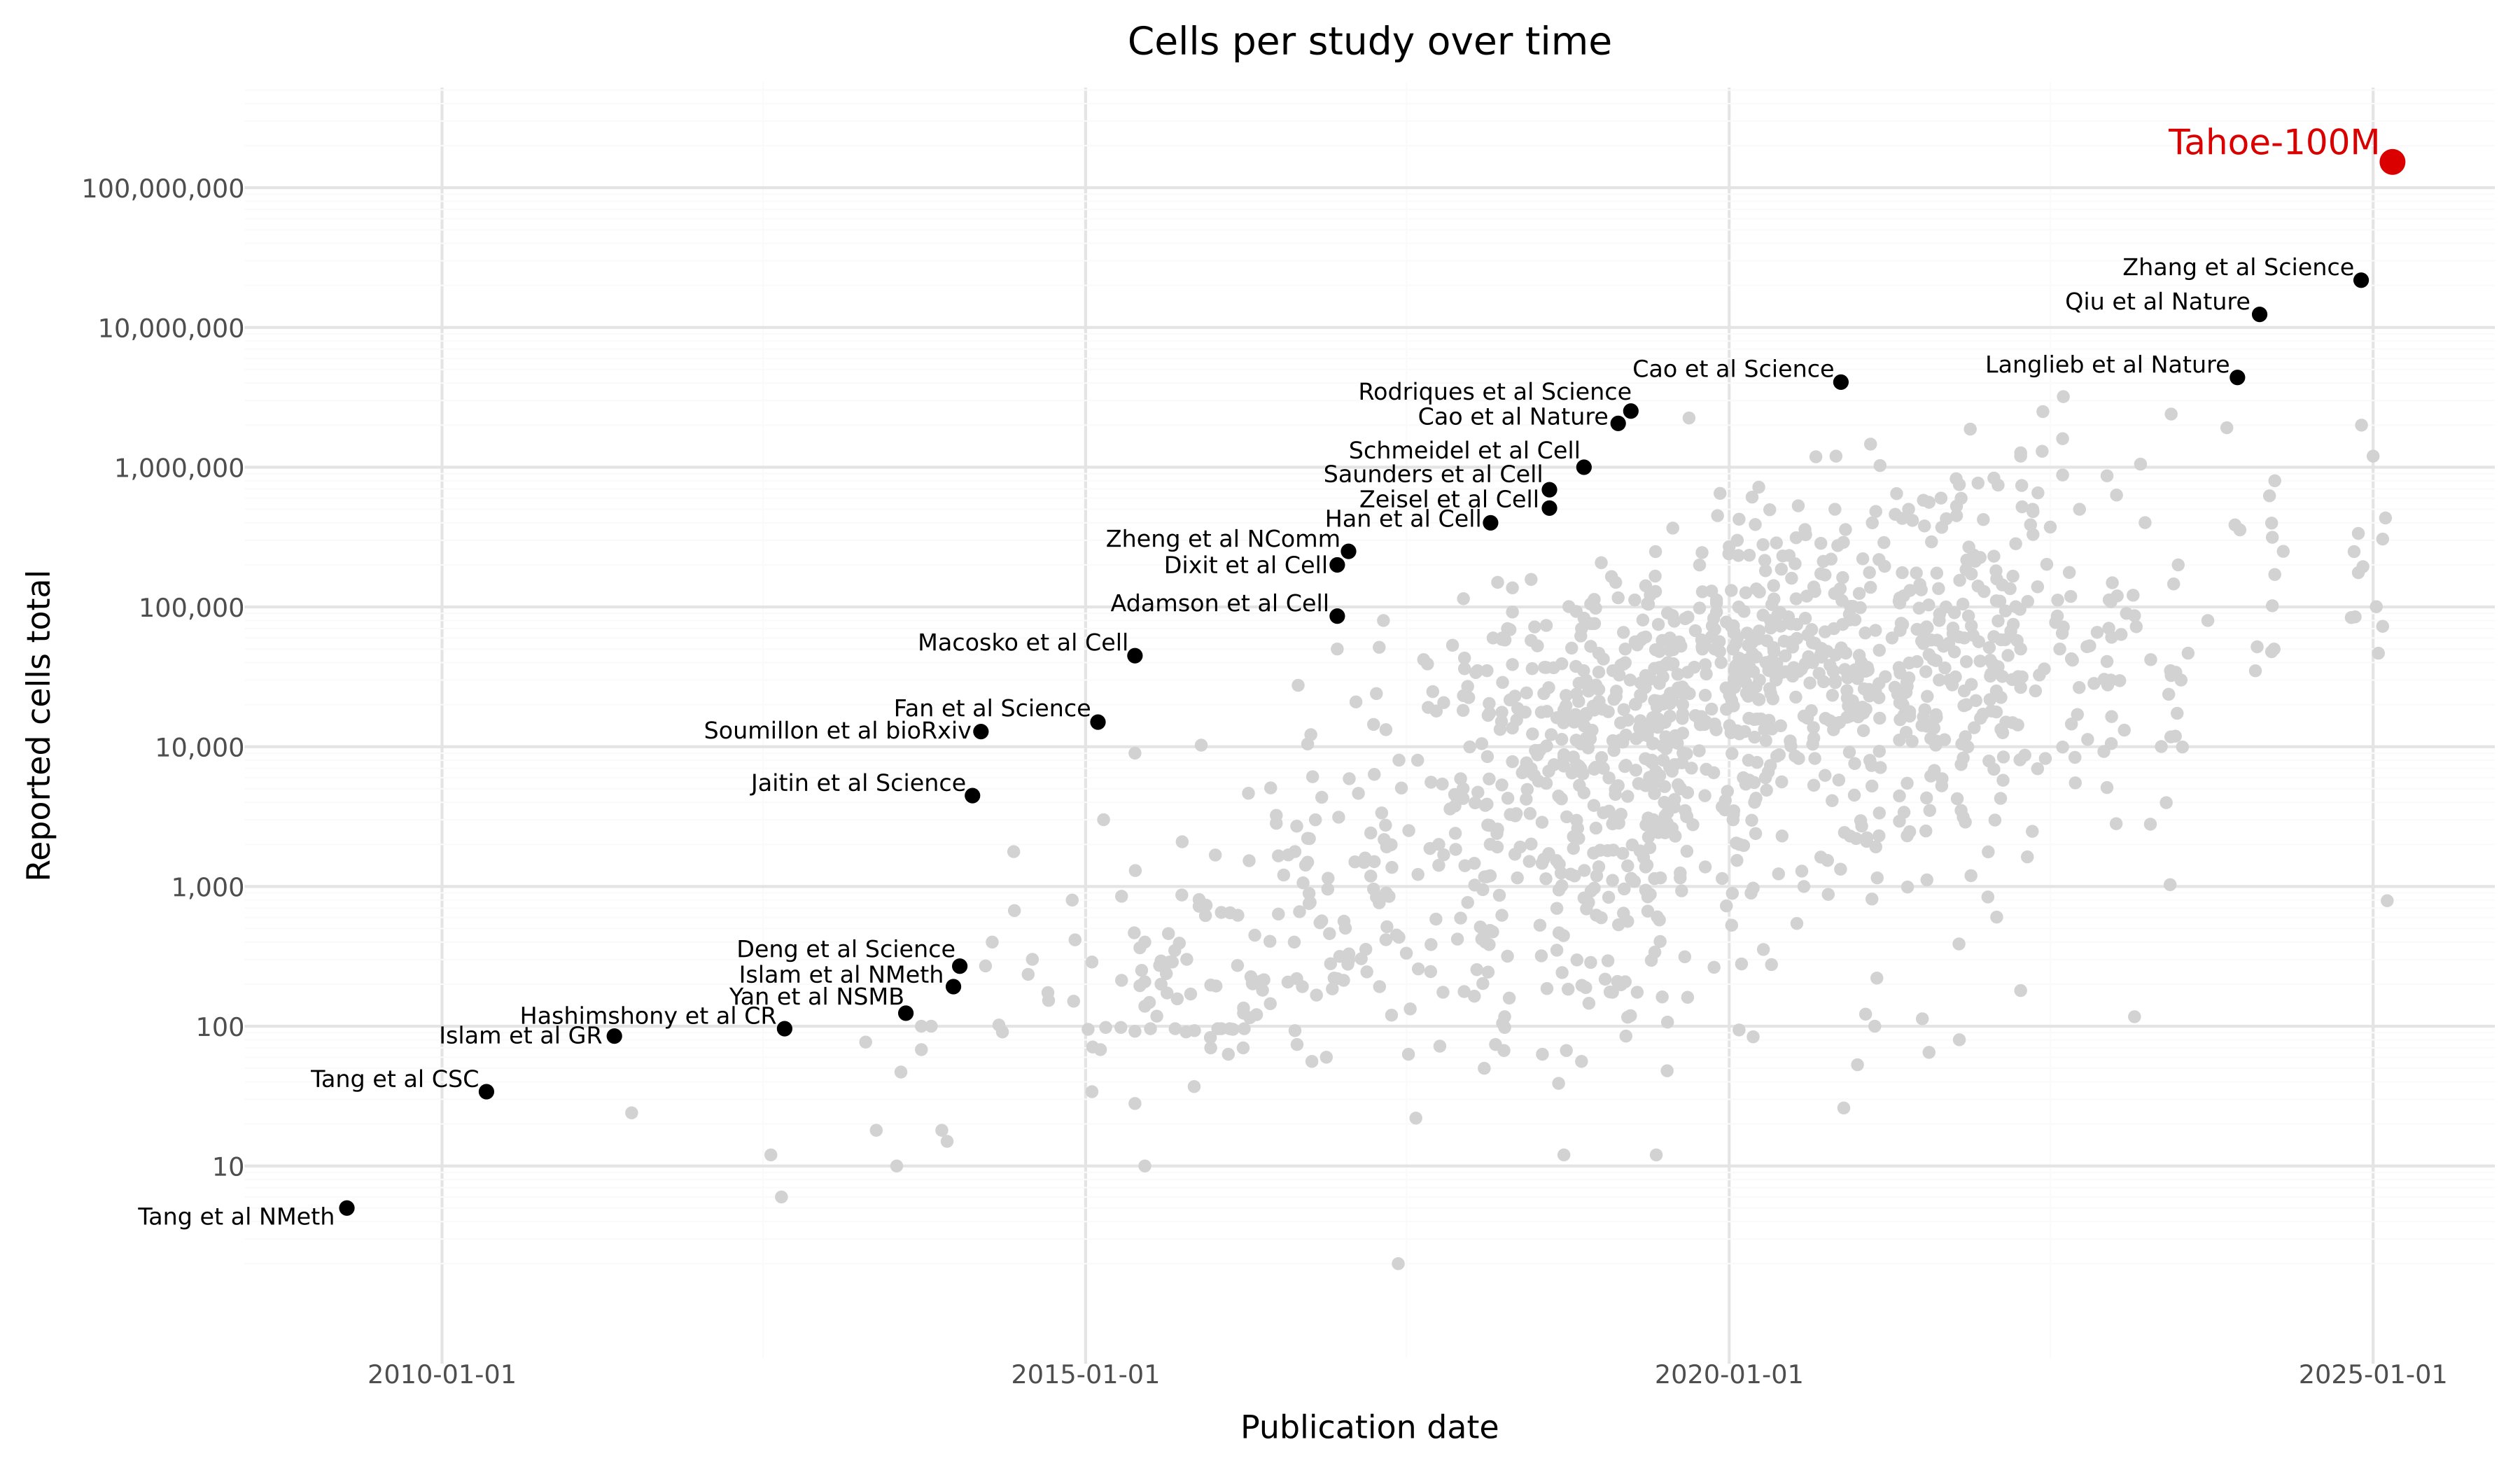
Tahoe-100M
Tahoe-100M is a giga-scale single-cell perturbation atlas consisting of over 100 million transcriptomic profiles from 50 cancer cell lines exposed to 1,100 small-molecule perturbations. Generated using Vevo Therapeutics' Mosaic high-throughput platform, Tahoe-100M enables deep, context-aware exploration of gene function, cellular states, and drug responses at unprecedented scale and resolution. This dataset is designed to power the development of next-generation AI models of cell biology, offering broad applications across systems biology, drug discovery, and precision medicine.
Quickstart
from datasets import load_dataset
# Load dataset in streaming mode
ds = load_dataset("tahoebio/Tahoe-100m", streaming=True, split="train")
# View the first record
next(ds.iter(1))
Tutorials
Please refer to our tutorials for examples on using the data, accessing metadata tables and converting to/from the anndata format.
Please see the Data Loading Tutorial for a walkthrough on using the data.
| Notebook | URL | Colab |
|---|---|---|
| Loading the dataset from huggingface, accessing metadata, mapping to anndata | Link |
|
Community Resources
Here are a links to few resources created by the community. We would love to feature additional tutorials from the community, if you have built something on top of Tahoe-100M, please let us know and we would love to feature your work.
| Resource | Contributor | URL |
|---|---|---|
| Analysis guide for Tahoe-100M using rapids-single-cell, scanpy and dask | SCVERSE | Link |
| Tutorial for accessing Tahoe-100M h5ad files hosted by the Arc Institute | Arc Institute | Link |
Dataset Features
We provide multiple tables with the dataset including the main data (raw counts) in the expression_data table as well as
various metadata in the gene_metadata,sample_metadata,drug_metadata,cell_line_metadata,obs_metadata tables.
The main data can be downloaded as follows:
from datasets import load_dataset
tahoe_100m_ds = load_dataset("tahoebio/Tahoe-100M", streaming=True, split="train")
Setting stream=True instantiates an IterableDataset and prevents needing to
download the full dataset first. See tutorial for an end-to-end example.
The expression_data table has the following fields:
| Field Name | Type | Description |
|---|---|---|
genes |
sequence<int64> |
Gene identifiers (integer token IDs) corresponding to each gene with non-zero expression in the cell. This sequence aligns with the expressions field. The gene_metadata table can be used to map the token_IDs to gene_symbols or ensembl_IDs. The first entry for each row is just a marker token and should be ignored (See data-loading tutorial) |
expressions |
sequence<float32> |
Raw count values for each gene, aligned with the genes field. The first entry just marks a CLS token and should be ignored when parsing. |
drug |
string |
Name of the treatment. DMSO_TF marks vehicle controls, use DMSO_TF along with plate to get plate matched controls. |
sample |
string |
Unique identifier for the sample from which the cell was derived. Can be used to merge information from the sample_metadata table. Distinguishes replicate treatments. |
BARCODE_SUB_LIB_ID |
string |
Combination of barcode and sublibary identifiers. Unique for each cell in the dataset. Can be used as an index key when referencing to the obs_metadata table. |
cell_line_id |
string |
Unique identifier for the cancer cell line from which the cell originated. We use Cellosaurus IDs were, but additional identifiers such as DepMap IDs are provided in the cell_line_metadata table. |
moa-fine |
string |
Fine-grained mechanism of action (MOA) annotation for the drug, specifying the biological process or molecular target affected. Derived from MedChemExpress and curated with GPT-based annotations. |
canonical_smiles |
string |
Canonical SMILES (Simplified Molecular Input Line Entry System) string representing the molecular structure of the perturbing compound. |
pubchem_cid |
string |
PubChem Compound Identifier for the drug, allowing cross-referencing with public chemical databases. An empty string is used for DMSO controls. Please cast to int before querrying pubchem. |
plate |
string |
Identifier for the 96-well plate (1–14) in which the mixed-cell spheroid was seeded and treated. |
Additional metadata
Gene Metadata
gene_metadata = load_dataset("taheobio/Tahoe-100M","gene_metadata", split="train")
| Column Name | Description |
|---|---|
gene_symbol |
The HGNC-approved gene symbol corresponding to each gene (e.g., TP53, BRCA1). |
ensembl_id |
The Ensembl gene identifier (e.g., ENSG00000000003) based on Ensembl release 109 and genome build 38. |
token_id |
An integer token ID used to represent each gene. This is the ID used in the genes field in the main data. |
Sample Metadata
sample_metadata = load_dataset("tahoebio/Tahoe-100M","sample_metadata", split="train")
The sample_metadata has additional information for aggregate quality metrics for the sample as well as the concentration.
| Column Name | Description |
|---|---|
sample |
Unique identifier for the sample from which the cell was derived. Unique key for this table. |
plate |
Identifier (1–14) for the 96-well plate for the sample |
mean_gene_count |
Average number of unique genes detected per cell for the given sample. |
mean_tscp_count |
Average number of transcripts (UMIs) detected per cell in the sample. |
mean_mread_count |
Average number of reads per cell. |
mean_pcnt_mito |
Mean percentage of total reads that map to mitochondrial genes, across cells in the sample. |
drug |
Name of the treatment used to perturb the cells in the sample. |
drugname_drugconc |
String combining the compound name, concentration and concentration unit (e.g., [('8-Hydroxyquinoline',0.05,'uM')]), used to uniquely label each treatment condition. |
Drug Metadata
drug_metadata = load_dataset("tahoebio/Tahoe-100M","drug_metadata", split="train")
The drug_metadata has additional information about each treatment.
| Column Name | Description |
|---|---|
drug |
Name of the treatment used to perturb the cells in the sample. Unique key for this table |
targets |
List of gene symbols representing the known molecular targets of the compound. Targets were proposed by GPT-4o based on compound names and then validated against MedChemExpress information. |
moa-broad |
Broad classification of the compound’s mechanism of action (MOA), typically categorized as "inhibitor/antagonist," "activator/agonist," or "unclear." GPT-4o inferred this using compound target data and curated descriptions from MedChemExpress. |
moa-fine |
Specific functional annotation of the compound's MOA (e.g., "Proteasome inhibitor" or "MEK inhibitor"). These fine-grained labels were selected from a curated list of 25 MOA categories and assigned by GPT-4o with validation against compound descriptions. |
human-approved |
Indicates whether the compound is approved for human use ("yes" or "no"). GPT-4o provided these labels using prior knowledge and validation from public sources such as clinicaltrials.gov. |
clinical-trials |
Indicates whether the compound has been evaluated in any registered clinical trials ("yes" or "no"). Determined using GPT-4o and corroborated using clinicaltrials.gov searches. |
gpt-notes-approval |
Contextual notes generated by GPT-4o summarizing the compound’s approval status, common clinical usage, or nuances such as formulation-specific approvals. |
canonical_smiles |
The compound's SMILES (Simplified Molecular Input Line Entry System) representation, capturing its molecular structure as a text string. |
pubchem_cid |
The PubChem Compound Identifier (CID), a unique numerical ID linking the compound to its entry in the PubChem database. |
Cell Line Metadata
cell_line_metadata = load_dataset("tahoebio/Tahoe-100M","cell_line_metadata", split="train")
The cell-line metadata table has additional information about the key driver mutations for each cell line.
| Column Name | Description |
|---|---|
cell_name |
Standard name of the cancer cell line (e.g., A549). |
Cell_ID_DepMap |
Unique identifier for the cell line in the DepMap project (e.g., ACH-000681) |
Cell_ID_Cellosaur |
Cellosaurus accession ID (e.g., CVCL_0023). This is the ID used in the main dataset. |
Organ |
Tissue or organ of origin for the cell line (e.g., Lung), used to interpret lineage-specific responses and biological context. |
Driver_Gene_Symbol |
HGNC-approved symbol of a known or putative driver gene with functional alterations in this cell line (e.g., KRAS, CDKN2A). We report a curated list of driver mutations per cell-line. |
Driver_VarZyg |
Zygosity of the driver variant (e.g., Hom for homozygous, Het for heterozygous) |
Driver_VarType |
Type of genetic alteration (e.g., Missense, Frameshift, Stopgain, Deletion) |
Driver_ProtEffect_or_CdnaEffect |
Specific protein or cDNA-level annotation of the mutation (e.g., p.G12S, p.Q37), providing precise information on the variant’s consequence. |
Driver_Mech_InferDM |
Inferred functional mechanism of the mutation (e.g., LoF for loss-of-function, GoF for gain-of-function) |
Driver_GeneType_DM |
Classification of the driver gene as an Oncogene or Suppressor |
Citation
Please cite:
@article{zhang2025tahoe,
  title={Tahoe-100M: A Giga-Scale Single-Cell Perturbation Atlas for Context-Dependent Gene Function and Cellular Modeling},
  author={Zhang, Jesse and Ubas, Airol A and de Borja, Richard and Svensson, Valentine and Thomas, Nicole and Thakar, Neha and Lai, Ian and Winters, Aidan and Khan, Umair and Jones, Matthew G and others},
  journal={bioRxiv},
  pages={2025--02},
  year={2025},
  publisher={Cold Spring Harbor Laboratory}
}